Finding 1 · When
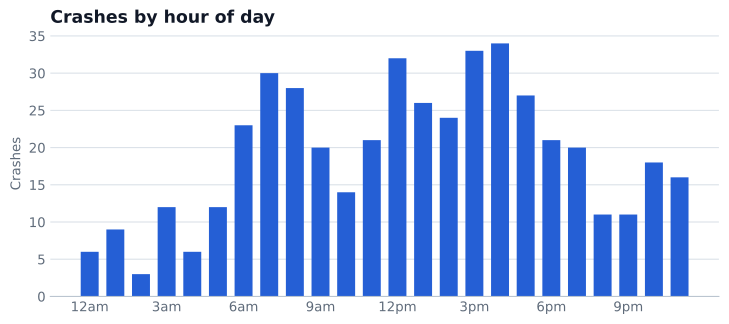
Crashes peak in the mid-afternoon.
Crashes rise with the morning commute, reaching 30 an hour at 7am, and peak at 3pm and 4pm with 33 and 34 crashes. The quietest hour is 2am, with 3.
Finding 2 · Where
Crashes concentrate on the busiest roads.
The Pacific Motorway (48), the Bruce Highway (42) and the Gateway Motorway (22) account for a quarter of all crashes. 329 of the 457 (72%) happened in South East Queensland.
Colour shows where crashes overlap: blue for a few, red for the densest areas.
Finding 3 · Together
Crashes cluster in time and place.
About 1 in 20 crashes (22 of 457) was followed by another crash within 2 km and 2 hours, 24 pairs in total. If crash timing were random, even after accounting for time of day, we would expect roughly half that. The data cannot show the cause, but the pattern is consistent with secondary crashes: crashes triggered by the queues and sudden braking around an earlier one.
A practical takeaway: the area around a fresh crash sees more crashes, so slowing down when passing one is a sensible precaution.
Three examples from the data:
Limitations
What more data would add.
Traffic volumes would turn these counts into crash rates, showing which roads and hours carry the most risk per vehicle. A longer collection period would sharpen the crash-pair estimate, currently between 1.3 and 3.1 times chance, and help explain what links the pairs.
Method
How the data was collected and analysed.
A Python collector polls the QLDTraffic API every 60 seconds and stores every incident, and each change to it, in PostgreSQL on a cloud server. For this report, a snapshot of the database was exported and analysed in Python with pandas.